Vignesh SureshDMS Coordinates to Decimal Coordinates for Maps in TableauWhen dealing with geographic data in Tableau, you might encounter coordinates expressed in the DMS format i.e. for degrees, minutes, and…6d ago6d ago
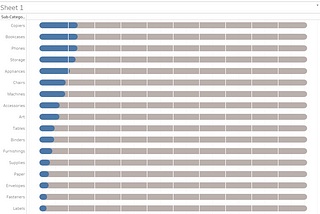
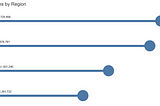
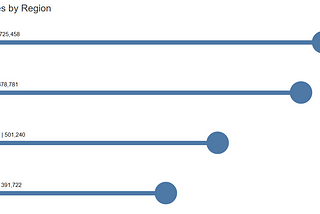
Vignesh SureshLollipop Chart with Labels above the BarYou might be familiar with Lollipop Charts and also to display labels above the bar in the simple bar chart. How about combining them?Nov 7, 2023Nov 7, 2023
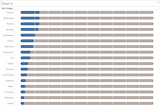
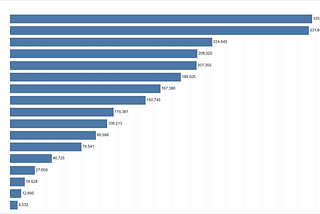
Vignesh SureshTableau Tip: Top and Bottom with IndexYou might have seen Top 10 and Bottom 10 with Sets. To show both of them together, we use a Combined Set. In this tutorial, I will be…Sep 24, 2023Sep 24, 2023
Vignesh SureshColor Coded Annotations in TableauColor-coded annotations in Tableau can be useful for highlighting specific data points or adding additional information to your…Sep 16, 2023Sep 16, 2023
Vignesh SureshSortable Pie Wedges (A Guest blog by Ray Givler)The following is a guest blog post from Ray Givler. Ray works as a Senior Decision Support Consultant, who uses Tableau to create…Jun 17, 2023Jun 17, 2023
Vignesh SureshVariance and Growth in SQLIn this tutorial, I will show you how to find Variance and Growth in SQLMay 21, 2023May 21, 2023
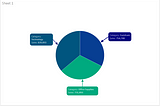
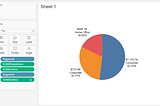
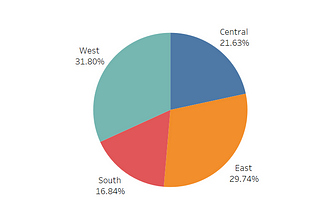
Vignesh SureshHow to change the Orientation of the Pie chart in Tableau with ParametersWith a little help from ChatGPT and research, I am here to show you how to change the Orientation of the Pie chart in Tableau with…May 6, 2023May 6, 2023
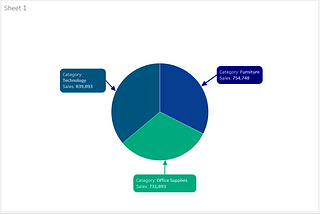
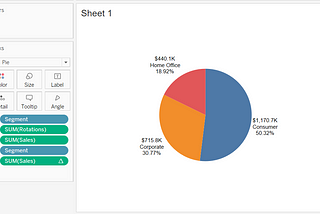
Vignesh Suresh12 Calculations for Calculating Part of the Pie/Percent of Total in TableauIn this blog, I will show you 12 calculations for calculating the Percent of the Total or Part of the Pie in Tableau.Apr 13, 20231Apr 13, 20231