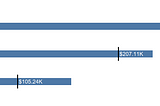
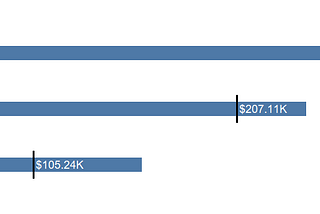
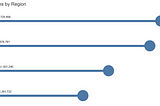
Bar and Avg Line with a Twist.In this tutorial, I will show you how to add Labels above the Bar and show Prior Sales with an Avg LineFeb 13Feb 13
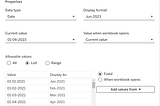
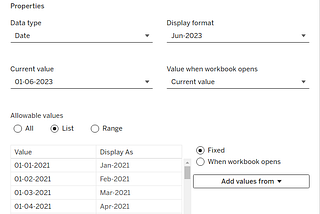
Custom Financial Year Period in TableauIn India, the Financial Year starts from April. But there are many Countries where Financial Year starts from July, October etc. In this…Dec 16, 2024Dec 16, 2024
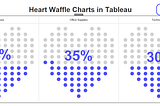
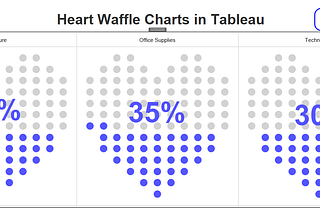
Creating Heart Waffles in TableauI was busy with other things and personal commitments, so I am a little late with this blog.Nov 2, 2024Nov 2, 2024
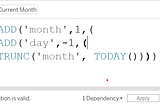
Calculation Series: How to find Last day of the current month, Last day of the previous month, and…In this blog, I will be showing you how to create Calculations for Last day of the current month, Last day of the previous month and Last…Sep 21, 2024Sep 21, 2024
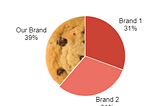
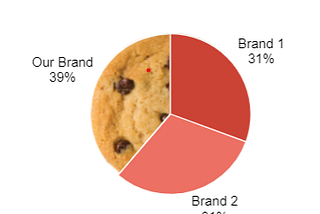
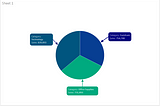
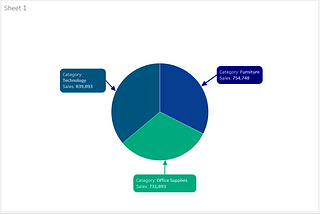
3 Pie/Doughnut Charts in Tableau with Map Layers.In this tutorial, I will show how to create 3 Pie/Doughnut Charts in Tableau. We will use Map Layers for each of these tutorials, so…Sep 1, 2024Sep 1, 2024
DMS Coordinates to Decimal Coordinates for Maps in TableauWhen dealing with geographic data in Tableau, you might encounter coordinates expressed in the DMS format i.e. for degrees, minutes, and…Jul 20, 2024Jul 20, 2024
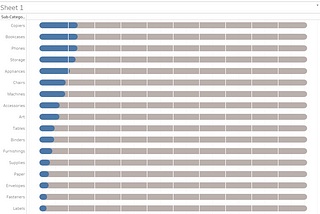
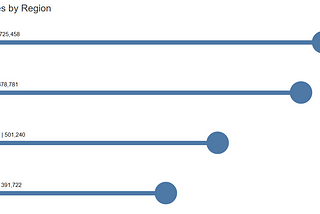
Lollipop Chart with Labels above the BarYou might be familiar with Lollipop Charts and also to display labels above the bar in the simple bar chart. How about combining them?Nov 7, 2023Nov 7, 2023
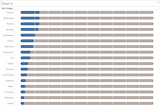
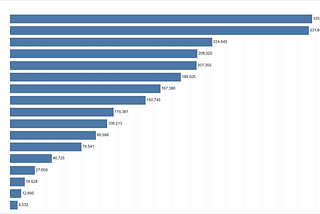
Tableau Tip: Top and Bottom with IndexYou might have seen Top 10 and Bottom 10 with Sets. To show both of them together, we use a Combined Set. In this tutorial, I will be…Sep 24, 2023Sep 24, 2023
Color Coded Annotations in TableauColor-coded annotations in Tableau can be useful for highlighting specific data points or adding additional information to your…Sep 16, 2023Sep 16, 2023